

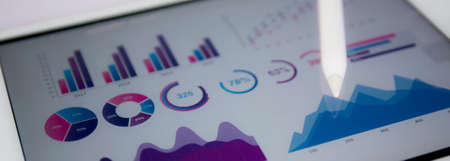
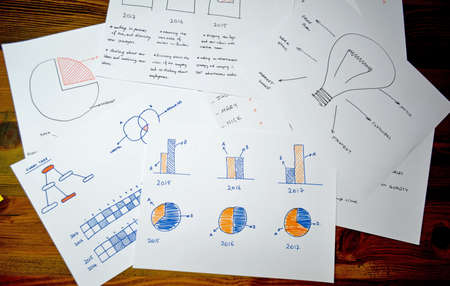
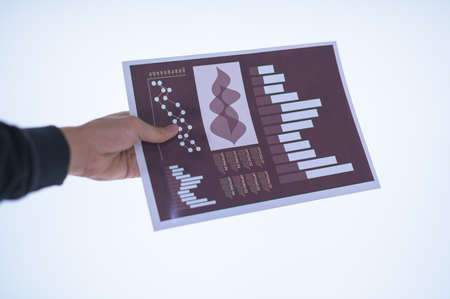
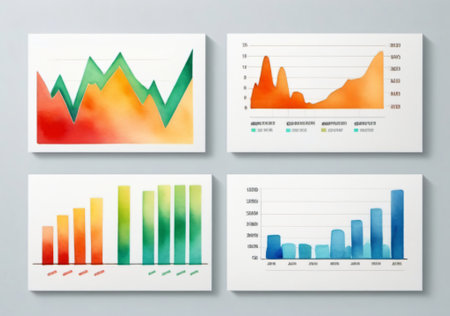
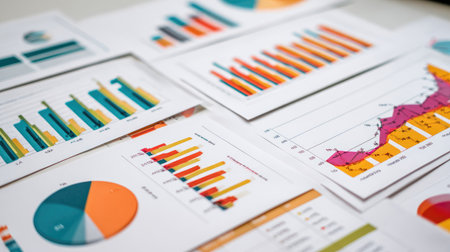
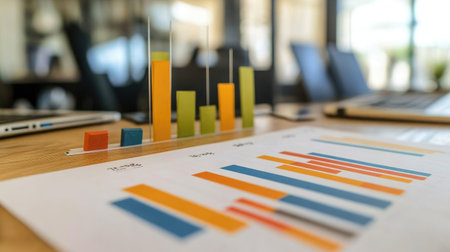
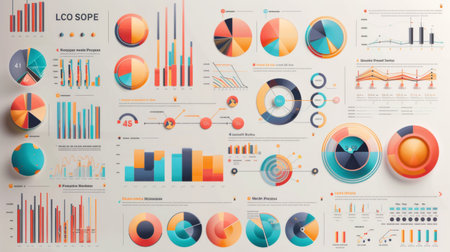
Many type of infographic diagram over white background. Top view.
Коллекция по умолчанию
Коллекция по умолчанию
Создать новую
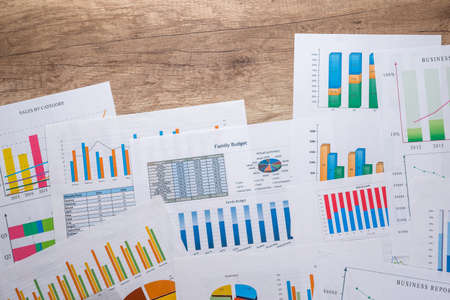
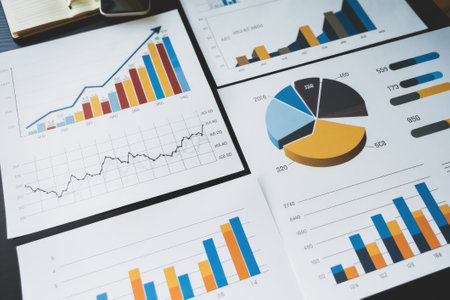
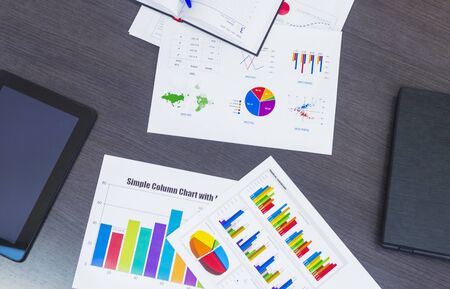
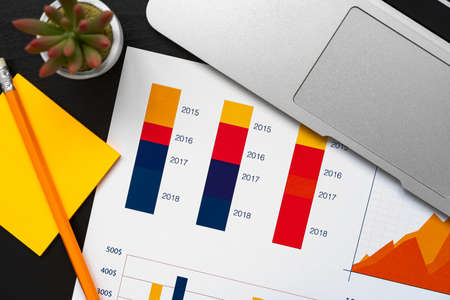
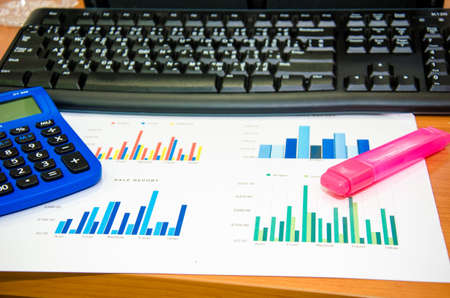
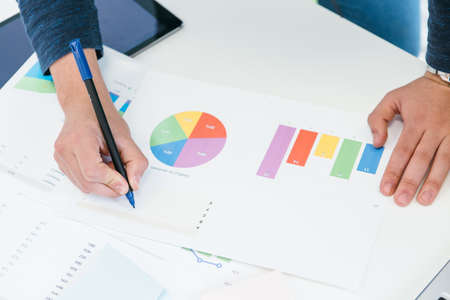
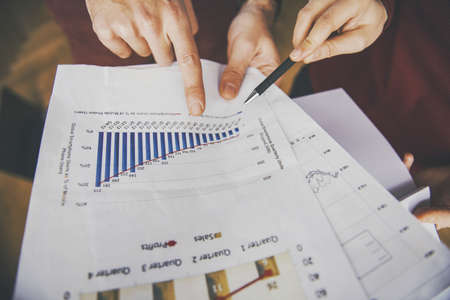
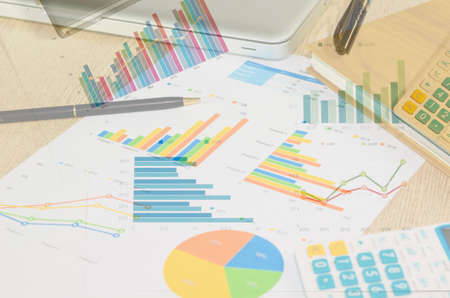
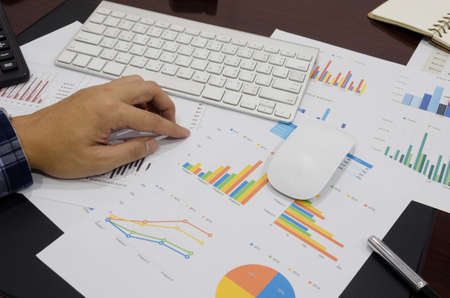
many different business graph with calculator and pen on desk.
Коллекция по умолчанию
Коллекция по умолчанию
Создать новую
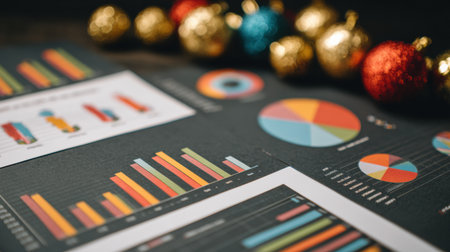
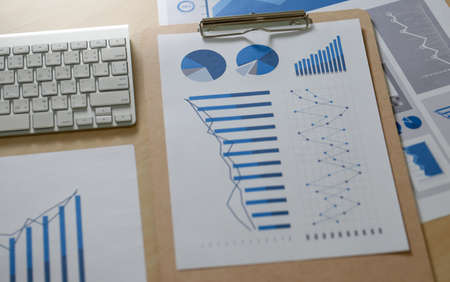
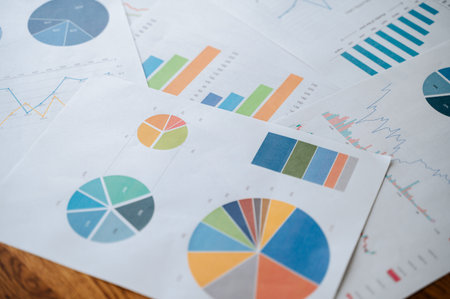
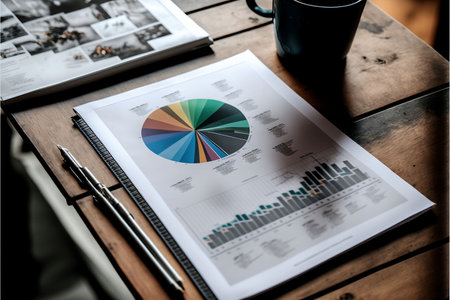
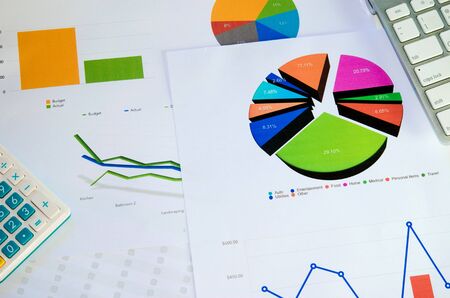
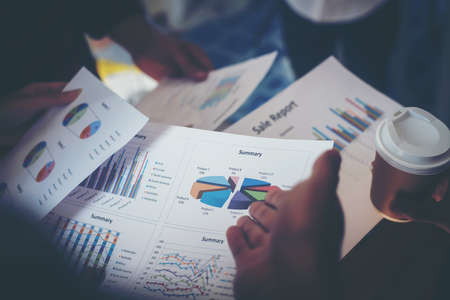
Charts and graphs display data insights on a table, while vibrant holiday ornaments add a festive touch to the workspace, creating a cheerful atmosphere.
Коллекция по умолчанию
Коллекция по умолчанию
Создать новую
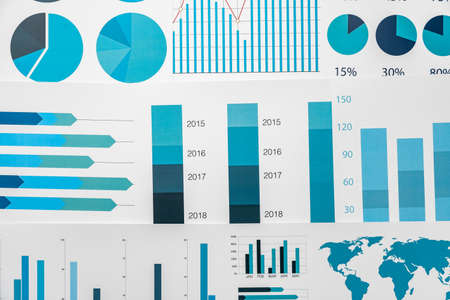
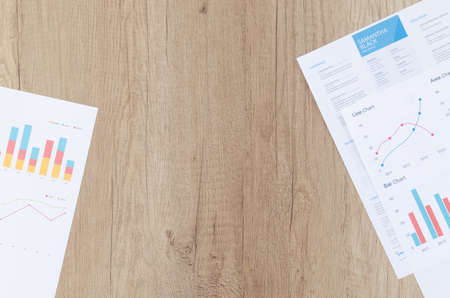
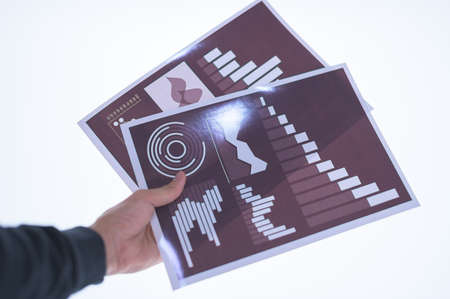
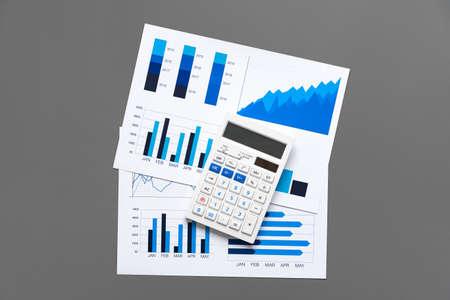
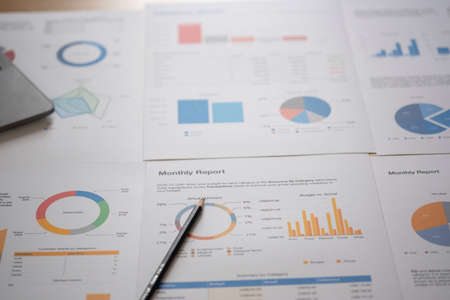
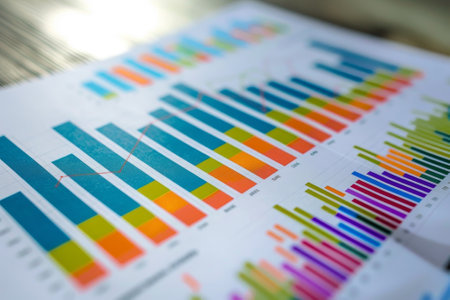
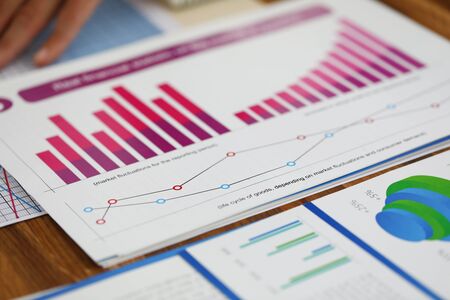
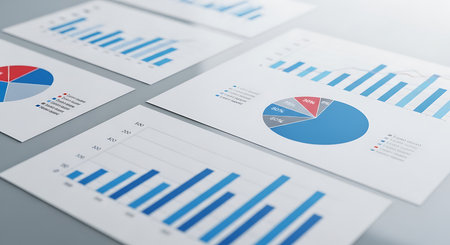
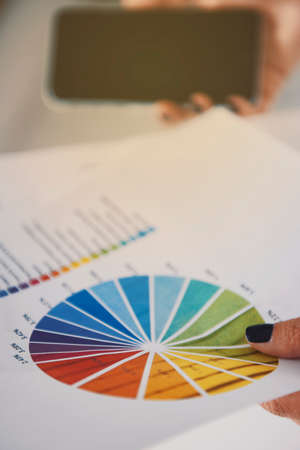
Financial paper with charts and diagrams on gray table
Коллекция по умолчанию
Коллекция по умолчанию
Создать новую

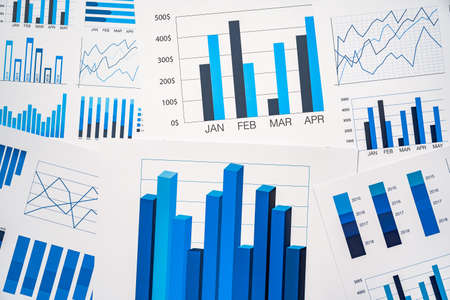
Virus pandemic covid-19 map on pc screen, global infection, internet.
Коллекция по умолчанию
Коллекция по умолчанию
Создать новую
Financial paper with charts and diagrams on gray table
Коллекция по умолчанию
Коллекция по умолчанию
Создать новую
Charts Graphs paper. Financial development, Banking Account, Statistics, Investment Analytic research data economy, Stock exchange Business office company meeting concept.
Коллекция по умолчанию
Коллекция по умолчанию
Создать новую

Line graph on desk and pen. Vintage filter
Коллекция по умолчанию
Коллекция по умолчанию
Создать новую

Charts Graphs paper. Financial development, Banking Account, Statistics, Investment Analytic research data economy, Stock exchange Business office company meeting concept.
Коллекция по умолчанию
Коллекция по умолчанию
Создать новую
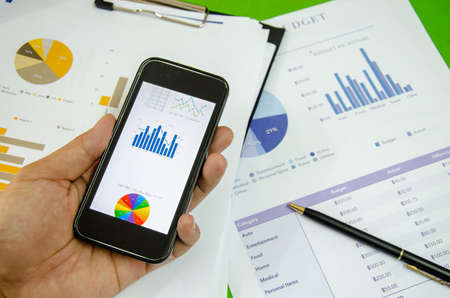
Graphs and phone
Коллекция по умолчанию
Коллекция по умолчанию
Создать новую

Colored sticker stripes on business analytics chart closeup
Коллекция по умолчанию
Коллекция по умолчанию
Создать новую

Business plan documents and charts for eco-tourism startup on rustic wooden table
Коллекция по умолчанию
Коллекция по умолчанию
Создать новую

business graph with pen
Коллекция по умолчанию
Коллекция по умолчанию
Создать новую

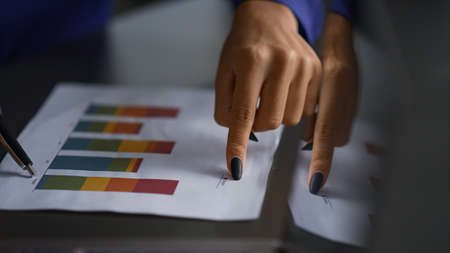
Analysis of data from graphs. select focus.
Коллекция по умолчанию
Коллекция по умолчанию
Создать новую

Graph of market share with black pen in business concept
Коллекция по умолчанию
Коллекция по умолчанию
Создать новую

Annual business report. Accountability paperwork. Hands holding a heap of documents with graphs and statistics
Коллекция по умолчанию
Коллекция по умолчанию
Создать новую
Close up of business graph analysis document
Коллекция по умолчанию
Коллекция по умолчанию
Создать новую
Business table with bar chart graphs.
Коллекция по умолчанию
Коллекция по умолчанию
Создать новую

Male hand showing diagram or chart on financial report with pen. Growth and success
Коллекция по умолчанию
Коллекция по умолчанию
Создать новую

ballpoint pen indicates income graphs lying on the table
Коллекция по умолчанию
Коллекция по умолчанию
Создать новую
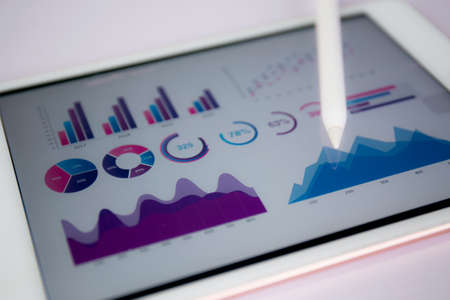
Report graph and chart of investment with finance on tablet computer on desk, datum of stock and growth, planning and statistic with economic, no people, digital marketing, business concept.
Коллекция по умолчанию
Коллекция по умолчанию
Создать новую
Business documents showing positive growth and financial success through charts and graphs
Коллекция по умолчанию
Коллекция по умолчанию
Создать новую
Business reports Teamwork on table report of documents Blue graphs and charts financial paperwork and reports
Коллекция по умолчанию
Коллекция по умолчанию
Создать новую
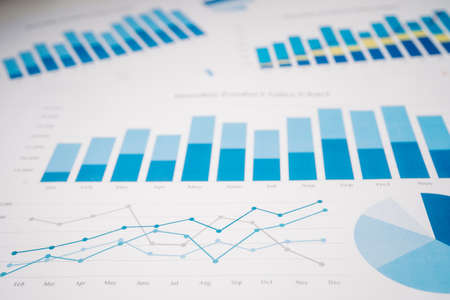
Chart graph paper. Financial development, Banking Account, Statistics, Investment Analytic research data economy, trading, Business company concept.
Коллекция по умолчанию
Коллекция по умолчанию
Создать новую

A vibrant collection of data visualization elements including colorful charts and graphs arranged on a dark surface, ideal for business analysis and presentation needs.
Коллекция по умолчанию
Коллекция по умолчанию
Создать новую
Workplace on wooden table with graph papers
Коллекция по умолчанию
Коллекция по умолчанию
Создать новую
Financial reports and charts on a office meeting office
Коллекция по умолчанию
Коллекция по умолчанию
Создать новую
Report graph and chart of investment with finance on tablet computer on desk, datum of stock and growth, planning and statistic with economic, no people, digital marketing, business concept.
Коллекция по умолчанию
Коллекция по умолчанию
Создать новую

Shallow depth of field (selective focus) with details of a chart showing the stock market crash from March 2020 due to the Covid-19 pandemic on a computer screen (S&P500 index)
Коллекция по умолчанию
Коллекция по умолчанию
Создать новую

business analysis and statistics concept, desk with mixed graphs and charts on clipboard
Коллекция по умолчанию
Коллекция по умолчанию
Создать новую
reports
Коллекция по умолчанию
Коллекция по умолчанию
Создать новую

Team work with results and reports
Коллекция по умолчанию
Коллекция по умолчанию
Создать новую
Printed graphs and laptop on dark gray surface
Коллекция по умолчанию
Коллекция по умолчанию
Создать новую
Businessman hand holding a document. Scenes white background.
Коллекция по умолчанию
Коллекция по умолчанию
Создать новую
Top view documents with analytics data on table
Коллекция по умолчанию
Коллекция по умолчанию
Создать новую
Businessman hand holding a document. Scenes white background.
Коллекция по умолчанию
Коллекция по умолчанию
Создать новую

Financial report and laptop on business desk
Коллекция по умолчанию
Коллекция по умолчанию
Создать новую

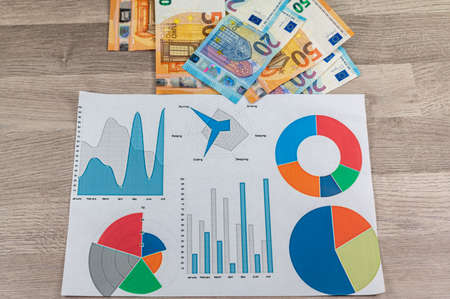
Financial paper with charts and diagrams on gray table
Коллекция по умолчанию
Коллекция по умолчанию
Создать новую
20 and 50 euro banknotes and wallet and cigar on wood background
Коллекция по умолчанию
Коллекция по умолчанию
Создать новую
Set of business card templates with colorful graphs and charts. Vector illustration.
Коллекция по умолчанию
Коллекция по умолчанию
Создать новую
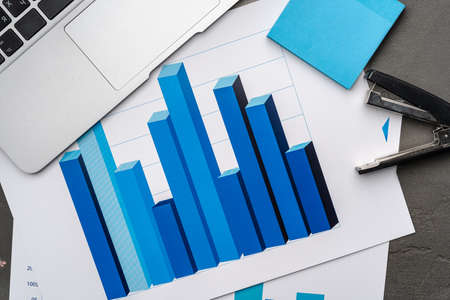
Printed graphs and laptop on dark gray surface
Коллекция по умолчанию
Коллекция по умолчанию
Создать новую
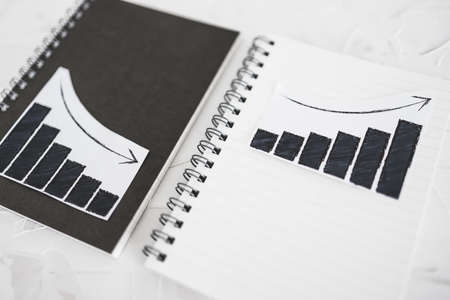
business analysis and statistics concept, positive and negative trends on graphs on notebooks side by side
Коллекция по умолчанию
Коллекция по умолчанию
Создать новую

reports and histograms on paper on the table in the hands of a girl, analytics and statistics on paper, business analytics
Коллекция по умолчанию
Коллекция по умолчанию
Создать новую
Business woman hands analyze diagram graph show financial charts information in office table. Close up female executive explaining presenting marketing data on conference. Corporate analysis concept.
Коллекция по умолчанию
Коллекция по умолчанию
Создать новую
An AI generated illustration of project management graphs charts paper
Коллекция по умолчанию
Коллекция по умолчанию
Создать новую

Close-up of a stock market analysis chart with a mix of bar graphs and line graphs highlighting key data
Коллекция по умолчанию
Коллекция по умолчанию
Создать новую
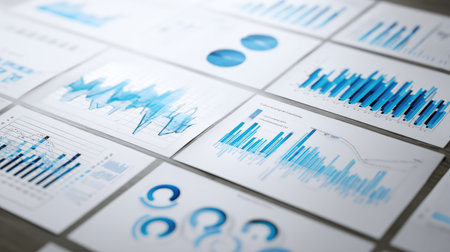
Explore an aerial view of detailed analytical reports showcasing various graphs and charts in blue tones, arranged on a wooden surface for business insights.
Коллекция по умолчанию
Коллекция по умолчанию
Создать новую
Financial paper with charts and diagrams on gray table
Коллекция по умолчанию
Коллекция по умолчанию
Создать новую
Business graphs and charts on table. Financial development, Banking Account, Statistics
Коллекция по умолчанию
Коллекция по умолчанию
Создать новую
Hands pointing to strategy on the wall
Коллекция по умолчанию
Коллекция по умолчанию
Создать новую

colorful bar graph pie chart desk pink background
Коллекция по умолчанию
Коллекция по умолчанию
Создать новую
Graphs
Коллекция по умолчанию
Коллекция по умолчанию
Создать новую

image of the financial graph on a computer monitor.
Коллекция по умолчанию
Коллекция по умолчанию
Создать новую
A close-up of a business report with colorful bar and line graphs.
Коллекция по умолчанию
Коллекция по умолчанию
Создать новую
Documents, graphs on a desk.
Коллекция по умолчанию
Коллекция по умолчанию
Создать новую
A collection of colorful graphs and charts displayed on papers, representing key business data for effective analysis and presentation in a professional setting.
Коллекция по умолчанию
Коллекция по умолчанию
Создать новую
Finance and accounting business, business planing, accounting
Коллекция по умолчанию
Коллекция по умолчанию
Создать новую

Business chart with line graph, bar chart and numbers on dark background, 3d rendering. Computer digital drawing.
Коллекция по умолчанию
Коллекция по умолчанию
Создать новую
relax, de-stress, holiday, happy, Asian woman relaxing at home listening to music from smartphone and laptop happily.
Коллекция по умолчанию
Коллекция по умолчанию
Создать новую

Financial paper charts and graphs on the table.Business Concept
Коллекция по умолчанию
Коллекция по умолчанию
Создать новую

Notebook work with statistics on the table
Коллекция по умолчанию
Коллекция по умолчанию
Создать новую
Digital cyberspace with data analysis process, high tech concept. Animation. Blocks of endlessly written program code, seamless loop.
Коллекция по умолчанию
Коллекция по умолчанию
Создать новую

Businesswoman holding a notepad at her desk, a group of businessmen attending a meeting and holding meeting materials, brainstorming meeting to plan a company's growth. Business meeting idea.
Коллекция по умолчанию
Коллекция по умолчанию
Создать новую
Faceless shot of man writing on paper with colorful diagrams standing at table in office.
Коллекция по умолчанию
Коллекция по умолчанию
Создать новую
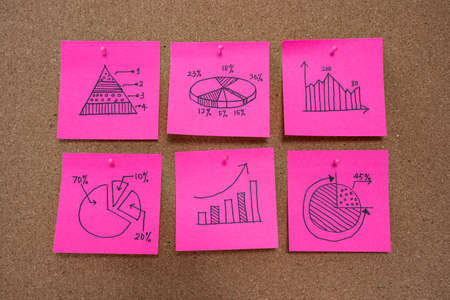
Different business graph charts on pink sticky notes for business planning and analysis
Коллекция по умолчанию
Коллекция по умолчанию
Создать новую

Financial stock market graph. Stock Exchange. Selective focus.
Коллекция по умолчанию
Коллекция по умолчанию
Создать новую

Business concept - Financial graphs drawn with colored pens
Коллекция по умолчанию
Коллекция по умолчанию
Создать новую
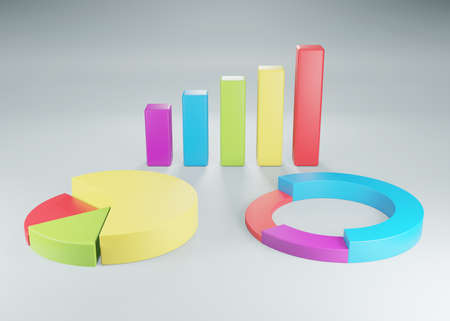
Business data elements bar pie charts diagrams and graphs. 3d rendering
Коллекция по умолчанию
Коллекция по умолчанию
Создать новую

businessman hand working on wooden desk in office and there are many documents, graphs. Can be attributed to financial articles.
Коллекция по умолчанию
Коллекция по умолчанию
Создать новую
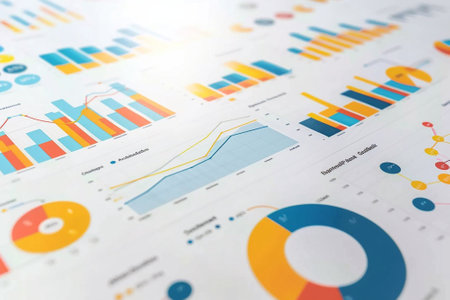
A close-up view of colorful charts and graphs representing business growth and analysis. Ideal for finance, marketing, and business presentations.
Коллекция по умолчанию
Коллекция по умолчанию
Создать новую
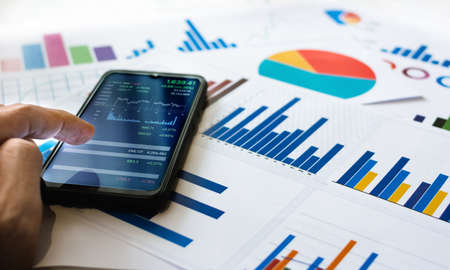
Close up view, asian businessman use finger touching on mobile screen to cheak set index of stocks and analyze chart on paperwork for investment plan
Коллекция по умолчанию
Коллекция по умолчанию
Создать новую

business analysis and statistics concept, desk with mixed graphs and charts on clipboard
Коллекция по умолчанию
Коллекция по умолчанию
Создать новую

Financial instruments with various types of indicators including volume analysis for professional technical analysis
Коллекция по умолчанию
Коллекция по умолчанию
Создать новую
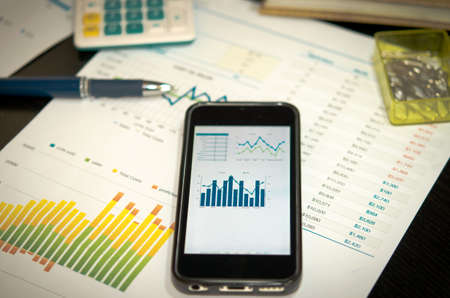
Business chart with smart phone and pen
Коллекция по умолчанию
Коллекция по умолчанию
Создать новую
Vector illustration depicting detailed data graph analysis in a business context against a clean white background. Perfect for presentations, reports, and infographics, artwork provides a visually appealing representation of business analytics.
Коллекция по умолчанию
Коллекция по умолчанию
Создать новую
Vibrant bar graphs displayed on an office desk, showcasing business metrics and statistics. Ideal for content related to finance, analysis, and performance.
Коллекция по умолчанию
Коллекция по умолчанию
Создать новую
Business reports
Коллекция по умолчанию
Коллекция по умолчанию
Создать новую
Business meeting coworkers discussing the project planning in office.
Коллекция по умолчанию
Коллекция по умолчанию
Создать новую
A colorful chart with many different colored bars and lines. The chart is titled Trends in the Stock Market
Коллекция по умолчанию
Коллекция по умолчанию
Создать новую

Image of financial data processing over empty warehouse. global shipping, delivery and connections concept digitally generated image.
Коллекция по умолчанию
Коллекция по умолчанию
Создать новую
Monthly percentage bar chart showing financial comparison of 2026 budget versus actual performance data displayed on digital screen. Results tracking.
Коллекция по умолчанию
Коллекция по умолчанию
Создать новую
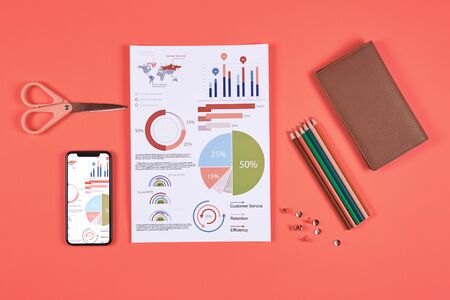
Above view flat lay of business data charts and office supplies over coral background, copy space
Коллекция по умолчанию
Коллекция по умолчанию
Создать новую
Analytic chart element, colorful infographics. Business statistic, diagram, data visualization, graph information.
Коллекция по умолчанию
Коллекция по умолчанию
Создать новую

reports
Коллекция по умолчанию
Коллекция по умолчанию
Создать новую
Close-up of biz documents with statistics data in charts, graphs and diagrams. Financial forecast of growth income. Stock Exchange, Securities Market concept. Blurred background
Коллекция по умолчанию
Коллекция по умолчанию
Создать новую
business background grown up concept the business chart document background.
Коллекция по умолчанию
Коллекция по умолчанию
Создать новую
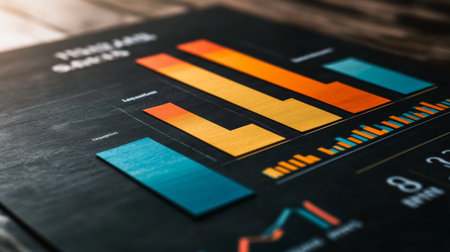
A vibrant bar chart displayed on a dark surface, showcasing data analysis and statistical trends, ideal for business presentations and reports.
Коллекция по умолчанию
Коллекция по умолчанию
Создать новую

Stock market or forex trading graph in graphic concept suitable for financial investment or Economic trends business idea and all art work design.
Коллекция по умолчанию
Коллекция по умолчанию
Создать новую
Financial papers, computer and office supplies closeup
Коллекция по умолчанию
Коллекция по умолчанию
Создать новую
Multiple business charts and graphs, including bar charts and pie charts, are spread across a surface. The visuals represent data, trends, and financial information for analysis.
Коллекция по умолчанию
Коллекция по умолчанию
Создать новую
business smartphone and pen on desk.
Коллекция по умолчанию
Коллекция по умолчанию
Создать новую
Business man investment analysis graphs.
Коллекция по умолчанию
Коллекция по умолчанию
Создать новую
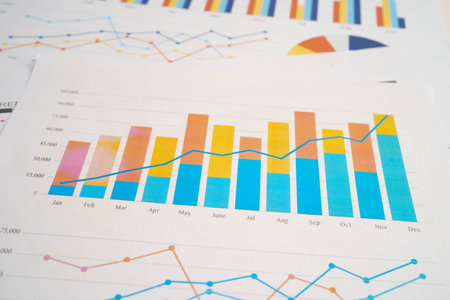
Chart graph paper. Finance, account, statistic, investment data economy, stock exchange business.
Коллекция по умолчанию
Коллекция по умолчанию
Создать новую
An infographic poster presenting statistical data in visually appealing graphs and illustrations for easy understanding.
Коллекция по умолчанию
Коллекция по умолчанию
Создать новую
Woman holding business reports
Коллекция по умолчанию
Коллекция по умолчанию
Создать новую

Close-up Of Two Different Colorful Charts On Laptop Keypad
Коллекция по умолчанию
Коллекция по умолчанию
Создать новую
A colorful bar chart showing quarterly sales growth for a tech startup, with upward trends highlighted
Коллекция по умолчанию
Коллекция по умолчанию
Создать новую
Business document paper placed on a white scene
Коллекция по умолчанию
Коллекция по умолчанию
Создать новую
financial charts and graphs on the table of the businessman, business concept
Коллекция по умолчанию
Коллекция по умолчанию
Создать новую

Abstract candlestick chart on white digital screen. Stock market or crypto data chart, graph with rectangular grid on light background.
Коллекция по умолчанию
Коллекция по умолчанию
Создать новую
Legion-Media
Создайте свои проекты на основе качественных стоковых фотографий и видео.


Copyright © Legion-Media.